In this assignment, students build a system for predicting patient deaths in the Intensive Care Unit (ICU) using the large PhysioNet Computing in Cardiology Challenge 2012 dataset. For each patient in the dataset, demographic variables and time series of physiological variables were collected during their stay in the ICU. Students model the impact of the system's flagging higher-risk patients for intervention on patients' survival in the ICU. The assignment illustrates the process of building an AI system and assessing its potential impact when only observational data is available.
Clinical risk prediction from physiological measurements, clinical notes, and demographic data using machine learning has seen advances in recent years. See Johnson et al. (2016) for a review of work on risk prediction for critical care and a popular press article (2019) about Google's efforts in the area.
|
|---|
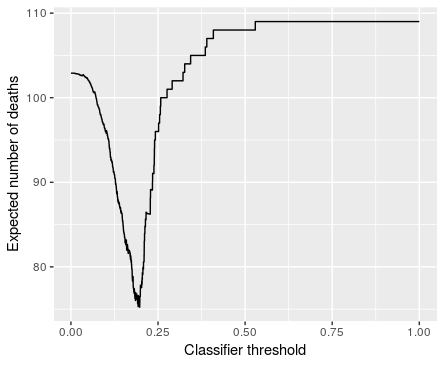
| Students generate a graph that shows the expected number of deaths in the validation set for different classifier thresholds for a scenario where risk prediction is used to prioritize charts, assuming the simulation model assumptions hold, and use the threshold that produces the smallest number of deaths in the final analysis that uses the test set. |
Evaluating the impact of a hypothetical intervention precisely using only observational data is not possible. However, we believe it is still important, both pedagogically and practically, to try to assess the impact of a new AI system. Students use simulation to model a setup where doctors have a limited amount of time to review a large number of patient charts, and the system helps prioritize patients' charts. Students estimate the percentage of patients who could be saved in the test set assuming the simulation model assumptions hold. Students like seeing a concrete estimate for the effectiveness of a system that they made.
We used the assignment in an Introduction to Data Science class for non-majors. Many of the students in our course do not have prior programming experience. The assignment can also be used as a first assignment in an AI class that introduces machine learning.
Introduction to Data Science classes with minimal or no pre-requisites, and taught in R, are becoming commonplace. They often involve predictive modelling. That means that students outside of computer science are now exposed to AI/machine learning early in their academic careers. In this assignment, we demonstrate how these students can be engaged. Students write interesting functions. We are also happy with the striking visualization of the effect of using the system could have that the students produce.
Since part of our goal is to teach programming, we restrict ourselves to basic subsets or R/tidyverse and Python/pandas/scikit-learn. Our solution presumes that students will use the basic features to implement much of the solution rather than look for readymade functions that will solve parts of the assignment for them.
The assignment was designed for R/tidyverse, but we provide a translation to Python/pandas/scikit-learn. The assignment assumes students have already seen logistic regression in a predictive modelling setting earlier in the course, and that students are familiar with performance measures such as the false positive rate and the false negative rate from lecture. The assignment assumes students may be somewhat new to programming.
| Summary | Students fit a logistic regression classifier to predict patient death in the ICU from physiological measurements and demographic information. Students use a simulation model of a setup where doctors have a limited amount of time to review a large number of patient charts, and the system helps prioritize the charts. Students estimate the percentage of patients who could be saved in the test set assuming the simulation model assumptions hold. |
| Topics | Logistic regression, parameter tuning, simulation, ROC curves, classifier performance measures |
| Audience | Students in introductory data science and AI classes. |
| Difficulty | This is a fairly difficult assignment for students in an Introduction to Data Science class that does not assume CS1. It could be used as a first assignment in a more advanced class. |
| Strengths |
|
| Weaknesses |
|
| Dependencies | R + tidyverse OR Python + pandas + scikit-learn, logistic regression for classification, classifier performance measures: false positives/false negatives/true positives/true negatives/correct classification rate. |
| Variants |
|
Main project (R markdown source). We will provide the solutions to instructors upon request.
Explain the dataset. Some students are excited to work with physiological data, but some are just confused. It may make sense to explain the dataset in class.
Linear regression is difficult. In our variant of the assignment, we asked for students to formulate and test a hypothesis about the data. Students found it quite challenging to find a situation where the assumptions of linear regression were satisfied, though it is possible to do.
Explicitly grade the quality of the report. We strongly recommend that instructors explicitly grade project reports on the quality of the writing. We found that this trick increases the quality of the reports substantially.