
Rook Jumping Maze Instructions: Starting at the circled cell in the upper-left corner, find a path to the goal cell marked “G”. From each numbered cell, one may move that exact number of cells horizontally or vertically in a straight line. How many moves does the shortest path have?
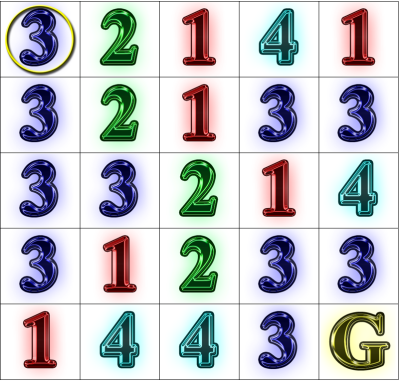
Solution (select to reveal): [19 moves: RDLRUDRLRLUDLDRRUDD]
Problem: Use the SARSA algorithm to learn an approximately optimal restart policy that maximizes the expected generation of long-solution 5x5 Rook Jumping Mazes per unit of computation.
Let us suppose that, for the purposes of this exercise, we wish to maximize the generation, per unit of computation, of Rook Jumping Mazes with minimum solution path lengths of at least 18 moves, i.e. with goal depth ≥ 18. When we terminate optimization at a threshold of satisfaction for our evaluation function, this is called satisficing. At every decision point, we will choose between two actions:
In our decision making we will consider two factors:
Thus, the current state can be described by the pair (t, d). To limit the size of our learning state space, we consider actions only for 5 values of t (0, ..., 4) and 6 values of d (17, 16, 15, 14, 13, 12). If d > 17, we have generated a satisficing maze and terminate search. Let us treat all mazes with d < 12 as being in a state with d = 12. In other words, d = 12 actually represents the set of all maze depths £ 12. If t > 4, we consider the hill descent to have taken too long, and we force the choice of the Restart action.
The goal of this exercise is to apply the SARSA algorithm to learn the optimal policy for Go/Restart actions so as to maximize the expected number of satisficing mazes (with d ≥ 18) per unit of computation, i.e. number of 250 iteration hill descent stages.
The SARSA algorithm is an on-policy temporal difference control method for estimating the expected utility for the current policy for each state and action pair. The policy we will use is an ε-greedy policy for action selection, that chooses a random action with probability ε, and otherwise chooses an action with the maximum estimated utility so far. If ε = 1, this is purely explorative, gaining information about the value of many different action sequences. If ε = 0, this is purely exploitative, taking advantage of estimates to provide the best estimated behavior. Through ε, we balance the priority of improving the estimate versus making good use of it. For this exercise, we'll choose ε = 0.1.
After taking an action in a state, there is an immediate reward. This reward can be negative (i.e. a cost). For each Go action, there is reward of -1 reflecting computational cost. For each satisficing maze, there is a reward of +1. Thus, a Restart action that (with very low probability) yields a satisficing maze would have a reward of 1, whereas the Restart reward would be 0 otherwise. A Go action that yields a satisficing maze would have a reward of -1 + 1 = 0, whereas the Go reward would be -1 otherwise.
The SARSA algorithm is described by Sutton and Barto as follows:
where s, s' are the current and next states (in our case, (t, d) pairs), a, a' are the current and next actions, Q(s, a) is the current estimate of all expected future rewards for the episode. In our case, an episode is the successful generation of a satisficing maze. Constant α is the learning rate, which we will set to .1. The learning rate affects how quickly Q will change value, and how volatile the estimate will be when experience is varied. Constant γ is the discount rate, which we will set to 1. When γ is less than 1, we discount expected future rewards in comparison to immediate rewards. The SARSA algorithm derives its name from the use of these variables: s, a, r, s', a'.
Execute SARSA learning for 2000 episodes. (Use fewer episodes for testing.) Print out the table of Q value estimates and how many updates occurred for each state. Finally evaluate the policy by comparing the number of hill descent iterations needed to generate 100 satisficing puzzles for a greedy policy (i.e. ε = 0), and policies that only restart at t = 1, 2, 3, 4, 5.
Possible background readings include:
Sample Transcript:
Policy ([R]estart/[G]o)
	17	16	15	14	13	12
0	Restart	Restart	Restart	Go	Restart	Go
1	Go	Go	Go	Go	Go	Go
2	Go	Go	Restart	Restart	Restart	Go
3	Go	Restart	Restart	Restart	Go	Go
4	Restart	Restart	Restart	Restart	Restart	Go

Q Visit Counts
	17	16	15	14	13	12
0	0	0	0	1	0	124528
1	459	1145	2104	2979	3297	7110
2	1553	2285	2263	1713	874	554
3	1721	1551	949	590	241	85
4	2099	1074	656	406	139	37

Restart Q Values
	17	16	15	14	13	12
0	  0.00	  0.00	  0.00	 -0.50	  0.00	-15.55
1	-10.34	-13.63	-14.74	-15.35	-15.38	-15.35
2	-14.21	-14.99	-15.14	-15.11	-15.04	-13.88
3	-14.97	-15.05	-15.11	-14.79	-13.19	 -8.20
4	-15.08	-15.04	-15.02	-14.67	-11.62	 -5.44

Go Q Values
	17	16	15	14	13	12
0	  0.00	  0.00	  0.00	  0.00	  0.00	-15.36
1	 -6.75	-10.74	-10.93	-14.28	-15.15	-15.35
2	 -9.99	-13.89	-15.43	-15.40	-15.10	-12.70
3	-13.27	-15.47	-15.19	-14.81	-13.11	 -7.81
4	-15.43	-15.16	-15.07	-14.70	-11.68	 -5.35

Policy comparison (SARSA vs. Hill Descent w/ Random Restarts):
Method	Puzzles	Iters	SARSA Fraction
SARSA	100	424750
HDwRR-1	100	2841750	0.149468
HDwRR-2	100	640000	0.663672
HDwRR-3	100	444750	0.955031
HDwRR-4	100	483000	0.879400
HDwRR-5	100	386250	1.099676
Questions: